CPU Usage Profiler Example
Source code path: example/system/cpu_usage_profiler
Supported Platforms
sf32lb52-lcd series
sf32lb56-lcd series
sf32lb58-lcd series
Overview
This example demonstrates the configuration and usage of cpu_usage_profiler, with features including:
CPU usage statistics: idle time (idle_run_time), non-idle time (other_run_time), CPU usage rate (default 2s statistics once).
Thread switching history records. Records the thread name and switching time for each thread switch.
Interrupt history records. Records the interrupt number and interrupt trigger time.
CPU Usage Metrics. Records CPU idle time (idle time), non-idle time (other run time), thread run time (thread run time). Supports:
Periodic printing.
Collection and storage through
Metrics Collectorfunctionality.
Tip
The time for thread switching and interrupt records is calculated based on GTIMER boot time (seconds/microseconds).
The statistical information of
CPU Usage Metricsis cleared and restarted after each collection or printing.
Example Usage
Hardware Requirements
Before running this example, you need to prepare a development board supported by this example.
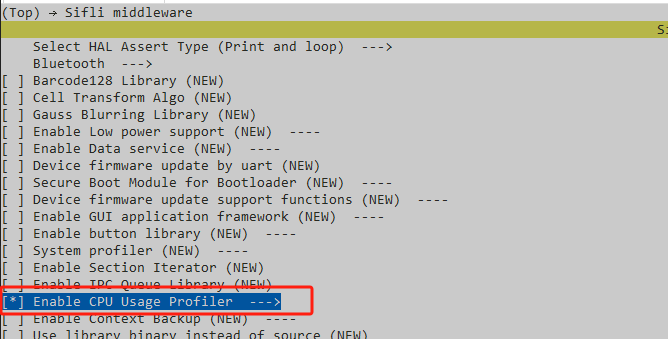
menuconfig Configuration
Enable cpu usage profiler (master switch):
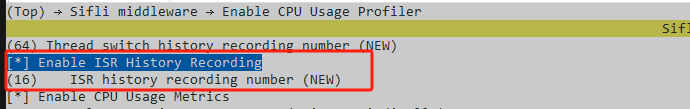
Configure task switching record count:

Configure interrupt history records (enable, configure record count):
Configure CPU Usage Metrics:
4.1 Enable Metrics:
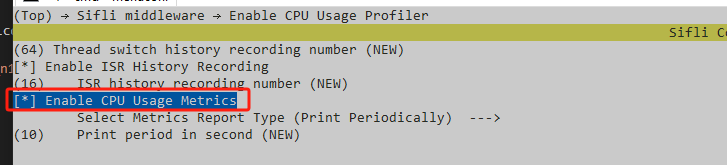
4.2 Configure report type:
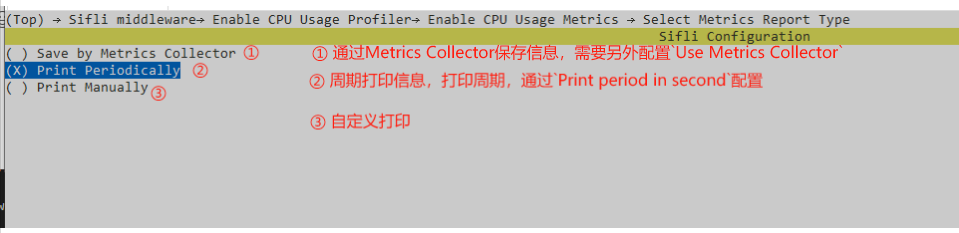
Tip
In this example,
report typeis configured as periodic printing.
Compilation and Flashing
Switch to the example project directory and run the scons command to compile:
scons --board=sf32lb52-lcd_n16r8 -j32
Run build_sf32lb52-lcd_n16r8_hcpu\uart_download.bat, select the port as prompted for download:
$ ./uart_download.bat

     Uart Download

please input the serial port num:5
For detailed steps on compilation and download, please refer to the relevant introduction in Getting Started Guide.
Expected Results
Thread switching history is saved in
thread_switch_hist, interrupt history records are saved inisr_hist, which can be viewed through online or offline means such asozone\T32. For example, when an exception occurs, you can easily see the thread switching records through T32: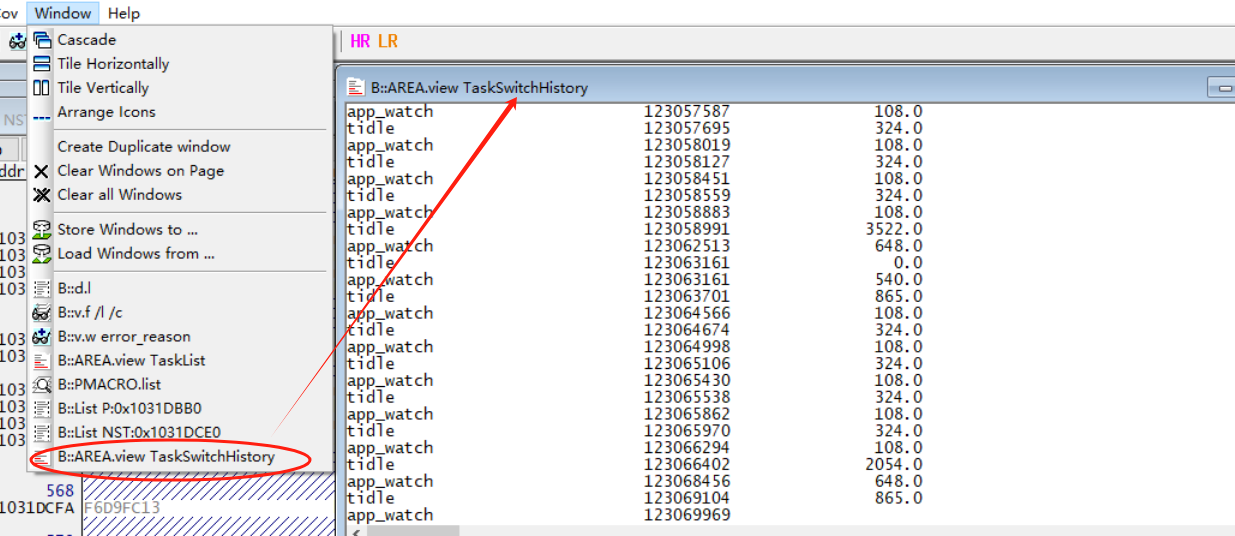
When CPU Usage Metrics is configured as periodic printing, it will periodically print
CPU Usageinformation (the printing period configured here is 10s):07-03 17:59:52:616 [328360] I/NO_TAG: ============================ 07-03 17:59:52:625 [0m[328382] I/NO_TAG: CPU Usage: 9.93/ 9.94 ( 0.15%) 07-03 17:59:52:632 [0m[328411] I/NO_TAG: ======================================================== 07-03 17:59:52:641 [0m[328442] I/NO_TAG: thread run_time(s) load(%) 07-03 17:59:52:648 [0m[328465] I/NO_TAG: -------------------------------------------------------- 07-03 17:59:52:662 [0m[328496] I/NO_TAG: [tshell ]: 0.01 0.15% 07-03 17:59:52:672 [0m[328518] I/NO_TAG: [tidle ]: 9.93 99.85% 07-03 17:59:52:680 [0m[328540] I/NO_TAG: [timer ]: 0.00 0.00% 07-03 17:59:52:692 [0m[328562] I/NO_TAG: [main ]: 0.00 0.00% 07-03 17:59:52:813 [0m 07-03 18:00:02:607 [656066] I/NO_TAG: ============================ 07-03 18:00:02:619 [0m[656087] I/NO_TAG: CPU Usage: 9.99/ 10.00 ( 0.07%) 07-03 18:00:02:627 [0m[656112] I/NO_TAG: ======================================================== 07-03 18:00:02:637 [0m[656143] I/NO_TAG: thread run_time(s) load(%) 07-03 18:00:02:644 [0m[656166] I/NO_TAG: -------------------------------------------------------- 07-03 18:00:02:653 [0m[656197] I/NO_TAG: [tshell ]: 0.00 0.00% 07-03 18:00:02:660 [0m[328218] I/NO_TAG: [tidle ]: 9.99 99.93% 07-03 18:00:02:670 [0m[328240] I/NO_TAG: [timer ]: 0.01 0.07% 07-03 18:00:02:678 [0m[328262] I/NO_TAG: [main ]: 0.00 0.00%
Supported FINSH commands:
Command
Description
cpu_prof_initInitialize profiler functionality
cpu_prof_deinitCancel profiler functionality
cpu_prof_resetReset CPU statistics
cpuPrint CPU statistics (if
CPU Usage Metricsis enabled, it will also print thread loads)The following is the
cpucommand print (hereCPU Usage Metricsis enabled):07-03 23:35:53:806 TX:cpu 07-03 23:35:53:811 [1049619] I/NO_TAG: CPU usage: 0.33 07-03 23:35:53:814 07-03 23:35:53:819 [0m[1049637] I/NO_TAG: ============================ 07-03 23:35:53:822 [0m[1049659] I/NO_TAG: CPU Usage: 1.94/ 1.95 ( 0.34%) 07-03 23:35:53:828 [0m[1049684] I/NO_TAG: ======================================================== 07-03 23:35:53:832 [0m[1049715] I/NO_TAG: thread run_time(s) load(%) 07-03 23:35:53:837 [0m[1049739] I/NO_TAG: -------------------------------------------------------- 07-03 23:35:53:839 [0m[1049770] I/NO_TAG: [tshell ]: 0.00 0.00% 07-03 23:35:53:844 [0m[1049792] I/NO_TAG: [tidle ]: 1.94 99.66% 07-03 23:35:53:848 [0m[1049814] I/NO_TAG: [timer ]: 0.01 0.34% 07-03 23:35:53:852 [0m[1049836] I/NO_TAG: [main ]: 0.00 0.00%
Exception Diagnosis
Reference Documentation
Update History
Version |
Date |
Release Notes |
|---|---|---|
0.0.1 |
07/2025 |
Initial version |