AssertDump
1. Overview
AssertDump is an in-house tool developed by SiFli Technology. Its primary function is to save memory data from a target board when it crashes, and then restore the firmware state using TRACE32 software for further analysis.
Tool path: tools/AssertDump
2. Environment Setup
AssertDump requires no installation and runs directly on Windows (XP / 7 / 10 / 11 …).
When using JLink to read memory data, JLink hardware and its companion software are required. The recommended steps are:
Purchase an official JLink device and install the SEGGER JLink Windows software. The version used during development of this tool is V680a.
Configure the
JLinkARM.dllpath in the tool’s configuration fileAssertDump.ini. There are two ways to do this:Without modifying
AssertDump.ini, copyJLinkARM.dlldirectly into the tool’s root directory.Modify the
JLINKDLLentry under the[COMMON]section ofAssertDump.ini. e.g.:JLINKDLL=C:\Program Files (x86)\SEGGER\JLink\JLinkARM.dll
3. Features
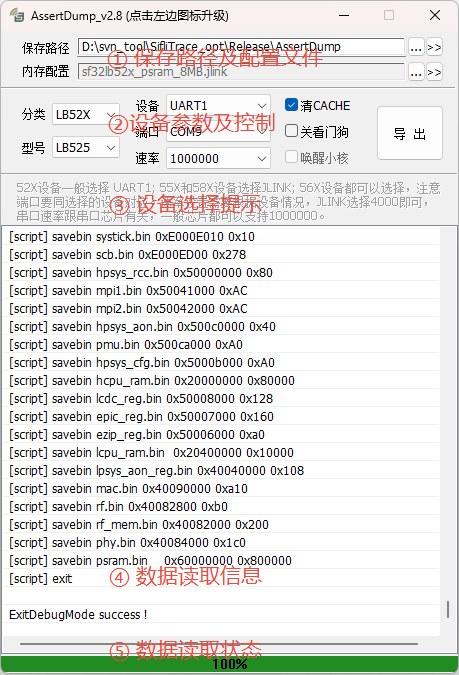
The main interface is shown above and consists of five areas:
① Save Path & Configuration File
Save Path Configures the directory where memory data is saved. The default is the tool’s current directory. Users can change the path; when saving data, a subfolder named after the current timestamp is created inside the specified directory. The two buttons to the right are Select Path and Open Path, respectively.
Memory Config Displays the configuration file currently used for reading memory. This file is bound directly to the chip. Users may temporarily select a different configuration file, but the selection is not persisted — reopening the tool or switching chips will revert to the default configuration file. The two buttons to the right are Select Config File and Edit Config File, respectively.
② Device Parameters & Control
Category Selects the chip family on the target board. For example, SF32LB525 belongs to the LB52X family.
Model Selects the specific chip model on the target board.
Device Selects the channel used to read memory data — either JLink or serial port. Refer to ③ Device Selection Guide.
Port After selecting a device, choose the COM port number or JLink SN here.
Speed After selecting a device, choose the serial port baud rate or JLink speed here. Refer to ③ Device Selection Guide.
Clear CACHE Some memory addresses are cache-enabled; clearing the cache is necessary to read the latest data. It is recommended to always check this option.
Disable Watchdog If the target board has a watchdog configured, it may reset during the memory dump after a crash. Enable this option to disable the watchdog in such cases.
Wake LCPU This option is enabled by default.
Export Controls the data export process. The export can be stopped mid-way using this button.
③ Device Selection Guide
Guides users to configure the device and related parameters for reading memory data, as shown in the screenshot above.
④ Data Read Log
Displays trace information during the data read process. Errors can be diagnosed using this log. Lines prefixed with [script] originate from the memory read configuration file.
⑤ Data Read Status
Shows the data read progress and final status. A failed export is displayed in red; a successful one in green. Generally, when progress reaches 100% the exported data is ready to use.
4. Usage
The tool is straightforward to use. Double-click to open it and follow the steps below:
Confirm the chip model on the target board and select the corresponding Category and Model.
Refer to ③ Device Selection Guide to configure the Device / Port / Speed.
Check Clear CACHE and Disable Watchdog.
Click Export and monitor ⑤ Data Read Status until the export finishes.